The Cayley diagram is the clearest visualizer for depicting groups as sets with structure. They also clearly show the group as acting on itself.
Before beginning, if you have not yet encountered the Cayley diagram visualizer, feel free to read its formal definition and a little information about it. Feel free also to refer to the documentation on the Cayley diagram interface in Group Explorer.
The Cayley diagram is the only visualizer in Group Explorer with the following two useful properties.
Cycle graphs also satisfy the first of these requirements, but not the second. Multiplication tables satisfy the second, but not the first. Consider the Cayley diagram of S3 shown below. There is a node in the diagram for each element of the group, and all information for determining the structure of the group can be immediately seen (or sometimes inferred) from the arrows connecting the nodes.
The fact thata red arrow goes from f to fr indicates that the red arrows signify right-multiplication by the generator r. So one can see how two generators (the red arrows meaning r and the blue-green arcs meaning f) combine to create all the structure of the group. Following a red arrow and then a blue-green one will lead you to a different location than following a blue-green arrow and then a red one; in this way one can see that S3 is not abelian.
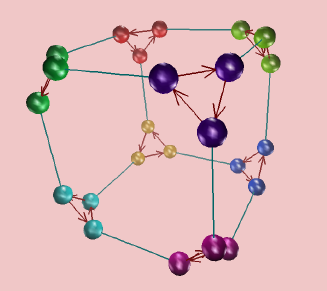
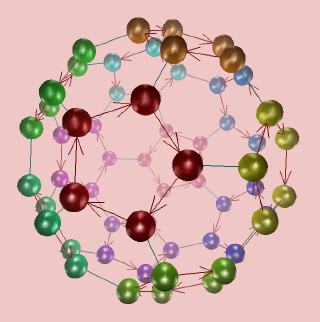
Often a group author will design a Cayley diagram for a group that has a particular beauty or symmetry which best shows off the symmetry inherent in the group. The author may do this because the standard algorithms Group Explorer uses for auto-generating Cayley diagrams are not always aesthetically good. Here are two pretty Cayley diagrams.
 |
| Above: A Cayley diagram for the group S4, with node color highlighted to indicate membership in cosets of the subgroup |
 |
| Above: A Cayley diagram for the group A5, with node color highlighted to indicate membership in cosets of the subgroup |
Note further that there are some things that most visualizers are good at; for instance, one can see a lattice of subgroups illustrated by multiplication tables, or a short exact sequence of groups. Both of these advanced uses of Cayley diagrams tie in homomorphisms, which are visible on sheets.
Quick help links:
Contents | Getting Started | Tutorials | User Manual | Miscellaneous Reference
GE terminology | Help on help