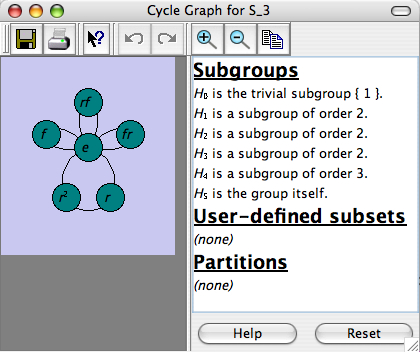
This page documents the interface for the large view of a cycle graph. A cycle graph is one of Group Explorer's four visualizers, all of which can appear either in help windows, sheets, or in their own windows. When they appear in their own windows, this is refered to as a "large view," and you can read about it in general here. This page concentrates specifically on the differences between a large view for cycle graphs, as compared to the other visualizers.

On the edit menu and on the toolbar for large windows viewing cycle graphs, you will find controls for Zoom in![]() and Zoom out
and Zoom out![]() . These controls simply change the magnification level at which you are viewing the cycle graph. For a very small cycle graph, you may want a large image, and zooming in is useful. For a very large cycle graph (and a not-so-large screen) you may find that zooming out is helpful.
. These controls simply change the magnification level at which you are viewing the cycle graph. For a very small cycle graph, you may want a large image, and zooming in is useful. For a very large cycle graph (and a not-so-large screen) you may find that zooming out is helpful.
The controls in the right side of the large window for cycle graphs are described in the help page for subset controls.
Quick help links:
Contents | Getting Started | Tutorials | User Manual | Miscellaneous Reference
GE terminology | Help on help